Navigating the world of investing can be daunting, but understanding stock market charts is a crucial step towards making informed decisions. These charts are visual representations of a stock’s performance over time and can help you predict future movements. In this blog post, we will delve into the essentials of stock market charts, exploring various types, their components, and how to use them effectively.
What Are Stock Market Charts?
Stock market charts are graphical tools that display the price movements of stocks over a specific period. These charts help investors analyze trends, identify patterns, and make informed decisions. By studying stock market charts, you can gain insights into the stock’s past performance and predict its future trajectory.
Types of Stock Market Charts
There are several types of stock market charts, each offering unique insights into stock performance. The most common types are line charts, bar charts, candlestick charts, and point-and-figure charts. Each type has its own strengths and is used for different purposes in stock market analysis.
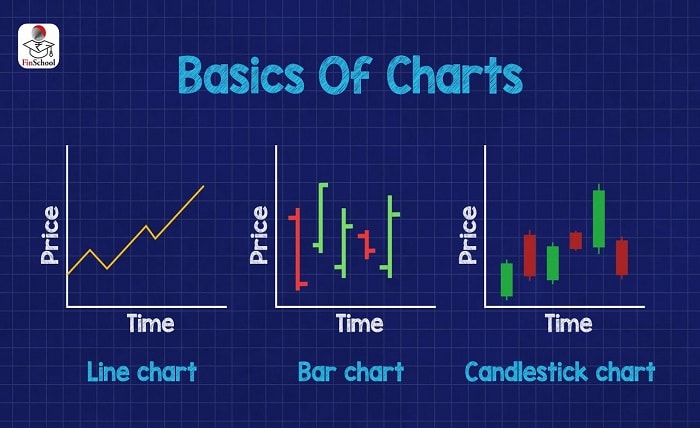
Line Charts
Line charts are the simplest form of stock market charts. They plot a single line connecting the closing prices of a stock over a period. Line charts are ideal for getting a quick overview of a stock’s performance and identifying long-term trends.
Bar Charts
Bar charts provide more detailed information than line charts. Each bar represents a single trading period and shows the stock’s opening, closing, high, and low prices. Bar charts are useful for understanding the daily price range and volatility of a stock.
Candlestick Charts
Candlestick charts are similar to bar charts but use a more visual format. Each candlestick represents a trading period and displays the opening, closing, high, and low prices. Candlesticks are color-coded to indicate whether the stock closed higher (typically green) or lower (typically red) than it opened. Candlestick charts are popular among traders for their detailed information and visual appeal.
Point-and-Figure Charts
Point-and-figure charts are unique in that they focus solely on price movements and ignore time. These charts use Xs and Os to represent price increases and decreases, respectively. Point-and-figure charts are helpful for identifying significant price movements and long-term trends without the noise of minor fluctuations.
Key Components of Stock Market Charts
Understanding the key components of stock market charts is essential for effective analysis. These components include the time frame, price scale, volume, and technical indicators. By mastering these elements, you can gain deeper insights into stock performance and make better investment decisions.
Time Frame
The time frame of a stock market chart determines the period over which the stock’s performance is displayed. Common time frames include daily, weekly, monthly, and yearly charts. Choosing the appropriate time frame is crucial for aligning your analysis with your investment goals.
Price Scale
The price scale on a stock market chart can be either linear or logarithmic. A linear scale shows equal spacing between price points, while a logarithmic scale shows percentage changes. Logarithmic scales are often used for long-term charts to better reflect significant price movements.
Volume
Volume represents the number of shares traded during a specific period and is a critical component of stock market charts. High trading volume can indicate strong investor interest and validate price movements, while low volume may suggest a lack of conviction.
Technical Indicators
Technical indicators are mathematical calculations based on price, volume, or other factors. These indicators help identify trends, momentum, and potential reversal points. Common technical indicators include moving averages, Relative Strength Index (RSI), and Bollinger Bands. Incorporating technical indicators into your analysis can enhance your understanding of stock market charts.
Interpreting Stock Market Charts
Interpreting stock market charts involves analyzing price patterns and trends to make predictions about future movements. Key patterns to look for include head and shoulders, double tops and bottoms, and triangles. Recognizing these patterns can help you anticipate potential price movements and make informed investment decisions.
Conclusion
Mastering stock market charts is an essential skill for any investor. By understanding the different types of charts, their key components, and how to interpret them, you can make more informed decisions and improve your investment outcomes. Whether you’re a beginner or a seasoned investor, taking the time to learn about stock market charts will pay off in the long run.
FAQs
1. What is the best type of stock market chart for beginners?
For beginners, line charts are the best type of stock market chart. They are simple to understand and provide a clear overview of a stock’s performance over time.
2. How can I choose the right time frame for my stock market chart analysis?
Choosing the right time frame depends on your investment goals. For short-term trading, use daily or weekly charts. For long-term investing, monthly or yearly charts are more appropriate.
3. What are some common mistakes to avoid when analyzing stock market charts?
Common mistakes include relying solely on charts without considering fundamental analysis, ignoring volume data, and overcomplicating analysis with too many technical indicators.
4. How can volume data enhance my analysis of stock market charts?
Volume data provides insight into the strength of price movements. High volume often confirms trends, while low volume can indicate weak or false movements.
5. Are stock market charts useful for predicting future stock prices?
While stock market charts can provide valuable insights and help identify potential trends, they are not foolproof predictors of future prices. It’s important to use them in conjunction with other analysis methods and stay updated on market news and events.